Foxmail是一款不错的邮件客户端软件,小巧实用,我在公司就是用的它。早上一如既往的先打开Foxmail,然后去倒杯水,回来发现Foxmail还在收取邮件的状态,“这也太慢了”,我心想。用鼠标点了点,出现了程序挂起的特征,标题栏上显示无法响应,程序界面变白。经验告诉我挂起的问题70%都还是比较容易调的,好吧,就让我看看这是怎么回事。
打开Windbg,Attach到Foxmail上,习惯做的第一件事情就是保存Full dump
.dump /ma /u e:\foxmail.dmp
由于程序的主界面出现了挂起的现象,而一般情况下主线程就是程序的界面线程,所以此时根本没必要去查看所有线程的情况,直接看看主线程的栈信息吧。
0:000> k
ChildEBP RetAddr
0018f454 770fd993 ntdll!ZwWaitForSingleObject+0x15
0018f4b8 770fd877 ntdll!RtlpWaitOnCriticalSection+0x13e
0018f4e0 770f84ca ntdll!RtlEnterCriticalSection+0x150
0018f514 76734e8c ntdll!RtlLockHeap+0x3d
0018f558 004091af KERNELBASE!GlobalAlloc+0x92
WARNING: Stack unwind information not available. Following frames may be wrong.
0018f578 0042bf97 Foxmail+0x91af
0018f588 0042c115 Foxmail+0x2bf97
0018f5a4 007c5f25 Foxmail+0x2c115
0018f9fc 007c50ce Foxmail+0x3c5f25
0018fa34 007c516a Foxmail+0x3c50ce
0018fa44 007c9e57 Foxmail+0x3c516a
0018faac 007ca28b Foxmail+0x3c9e57
0018fae0 007c9370 Foxmail+0x3ca28b
0018fb10 007ca3fb Foxmail+0x3c9370
0018fb1c 00dd8a96 Foxmail+0x3ca3fb
0018fb44 007c93bb Foxmail+0x9d8a96
0018fb64 007c9479 Foxmail+0x3c93bb
0018fba8 00dd0492 Foxmail+0x3c9479
0018fcd4 00dd019d Foxmail+0x9d0492
0018fd00 00dd454a Foxmail+0x9d019d
0018fd44 00dcf20d Foxmail+0x9d454a
0018fd60 007ca59d Foxmail+0x9cf20d
0018fd84 0044e9d6 Foxmail+0x3ca59d
0018fd94 0044e844 Foxmail+0x4e9d6
0018fdbc 00434a96 Foxmail+0x4e844
0018fdd4 74aa62fa Foxmail+0x34a96
0018fe00 74aa6d3a user32!InternalCallWinProc+0x23
0018fe78 74aa77c4 user32!UserCallWinProcCheckWow+0x109
0018fed8 74aa7bca user32!DispatchMessageWorker+0x3bc
0018fee8 00dc5e7a user32!DispatchMessageA+0xf
0018ff04 00dc5ee4 Foxmail+0x9c5e7a
0018ff2c 00dc61bf Foxmail+0x9c5ee4
0018ff5c 00ded3a0 Foxmail+0x9c61bf
0018ff88 75b9336a Foxmail+0x9ed3a0
0018ff94 770f9882 kernel32!BaseThreadInitThunk+0xe
0018ffd4 770f9855 ntdll!__RtlUserThreadStart+0x70
0018ffec 00000000 ntdll!_RtlUserThreadStart+0x1b
可以看到界面线程调用GlobalAlloc的时候在等HeapLock被释放。
0:000> kb L5
ChildEBP RetAddr  Args to Child
0018f454 770fd993 00000698 00000000 00000000 ntdll!ZwWaitForSingleObject+0x15
0018f4b8 770fd877 00000000 00000000 00000000 ntdll!RtlpWaitOnCriticalSection+0x13e
0018f4e0 770f84ca 014d0138 0044e9b8 0018f4ac ntdll!RtlEnterCriticalSection+0x150
0018f514 76734e8c 014d0000 4d5402d1 00000000 ntdll!RtlLockHeap+0x3d
0018f558 004091af 00000002 00002000 0042c07c KERNELBASE!GlobalAlloc+0x92
那么014d0138比如是默认堆的Critical Section了。来看看这个cs的数据
0:000> !cs 014d0138
*************************************************************************
***                                                                   ***
***                                                                   ***
***    Either you specified an unqualified symbol, or your debugger   ***
***    doesn't have full symbol information.  Unqualified symbol      ***
***    resolution is turned off by default. Please either specify a   ***
***    fully qualified symbol module!symbolname, or enable resolution ***
***    of unqualified symbols by typing ".symopt- 100". Note that   ***
***    enabling unqualified symbol resolution with network symbol     ***
***    server shares in the symbol path may cause the debugger to     ***
***    appear to hang for long periods of time when an incorrect      ***
***    symbol name is typed or the network symbol server is down.     ***
***                                                                   ***
***    For some commands to work properly, your symbol path           ***
***    must point to .pdb files that have full type information.      ***
***                                                                   ***
***    Certain .pdb files (such as the public OS symbols) do not      ***
***    contain the required information.  Contact the group that      ***
***    provided you with these symbols if you need this command to    ***
***    work.                                                          ***
***                                                                   ***
***    Type referenced: ntdll!_RTL_CRITICAL_SECTION                   ***
***                                                                   ***
*************************************************************************
Bad symbols for NTDLL (error 3). Aborting.
嗯,ntdll的符号文件的结构体信息没有了!这个问题发生在2015年7月份的,安装KB3071756和KB3060716补丁后产生的。详情可以查看http://www.osronline.com/showthread.cfm?link=269221
既然新的符号不让用,那就只有用老的了
0:000> .reload /f /i E:\WorkSpace\MySymbols\ntdll.dll\49900AFA96000\ntdll.dll=77ffe000
0:000> lm m ntdll*
start    end        module name
770c0000 77240000   ntdll      (pdb symbols)          e:\workspace\mysymbols\wntdll.pdb\FA9C48F9C11D4E0894B8970DECD92C972\wntdll.pdb
77ffe000 78094000   ntdll_77ffe000   (pdb symbols)          e:\workspace\mysymbols\ntdll.pdb\6992F4DAF4B144068D78669D6CB5D2072\ntdll.pdb
0:000> dt ntdll_77ffe000!_RTL_CRITICAL_SECTION 014d0138
   +0x000 DebugInfo        : 0x771c4960 _RTL_CRITICAL_SECTION_DEBUG
   +0x004 LockCount        : 0n-30
   +0x008 RecursionCount   : 0n1
   +0x00c OwningThread     : 0x00001730 Void
   +0x010 LockSemaphore    : 0x00000698 Void
   +0x014 SpinCount        : 0xfa0
好了,这样就够用了。可以看到TID=1730的线程正在占用这个cs,马上去看看这个线程在干什么。
0:041> k
ChildEBP RetAddr
06e1f214 770fd993 ntdll!ZwWaitForSingleObject+0x15
06e1f278 770fd877 ntdll!RtlpWaitOnCriticalSection+0x13e
06e1f2a0 770f84ca ntdll!RtlEnterCriticalSection+0x150
06e1f2d4 7717fd7d ntdll!RtlLockHeap+0x3d
06e1f3bc 7714de8e ntdll!RtlpQueryExtendedHeapInformation+0xbd
06e1f3fc 7716476b ntdll!RtlQueryHeapInformation+0x4a
06e1f4a0 77143320 ntdll!RtlQueryProcessHeapInformation+0x288
06e1f51c 75c15f4b ntdll!RtlQueryProcessDebugInformation+0x28a
Unable to load image D:\Program Files\Foxmail 7.2\libeay32.dll, Win32 error 0n2
*** ERROR: Symbol file could not be found.  Defaulted to export symbols for libeay32.dll -
06e1f54c 0606ad6a kernel32!Heap32Next+0x4d
WARNING: Stack unwind information not available. Following frames may be wrong.
06e1fab0 06069c77 libeay32!RAND_poll+0x5fa
06e1facc 06023db7 libeay32!RAND_SSLeay+0x447
06e1fb00 06069f71 libeay32!CRYPTO_set_ex_data_implementation+0x387
00000000 00000000 libeay32!RAND_SSLeay+0x741
从栈的信息看来,这个线程是OpenSSL的一个线程,正在做随机数处理,而枚举Heap的信息应该也是随机数的一个组成部分。在枚举Heap的时候也处于等待一个HeapLock的情况,来具体看看
0:041> kb L5
ChildEBP RetAddr  Args to Child
06e1f214 770fd993 00000b10 00000000 00000000 ntdll!ZwWaitForSingleObject+0x15
06e1f278 770fd877 00000000 00000000 06e1f428 ntdll!RtlpWaitOnCriticalSection+0x13e
06e1f2a0 770f84ca 04560138 00000000 00000000 ntdll!RtlEnterCriticalSection+0x150
06e1f2d4 7717fd7d 04560000 71edefe5 06e1f468 ntdll!RtlLockHeap+0x3d
06e1f3bc 7714de8e 06e1f428 771640d3 00000000 ntdll!RtlpQueryExtendedHeapInformation+0xbd
看来正在等一个基地址是04560000的Heap的cs。顺藤摸瓜看看这个cs又被谁占用了。
0:041> dt ntdll_77ffe000!_RTL_CRITICAL_SECTION 04560138
   +0x000 DebugInfo        : 0x0151df40 _RTL_CRITICAL_SECTION_DEBUG
   +0x004 LockCount        : 0n-6
   +0x008 RecursionCount   : 0n1
   +0x00c OwningThread     : 0x00001994 Void
   +0x010 LockSemaphore    : 0x00000b10 Void
   +0x014 SpinCount        : 0xfa0
继续看看0x00001994这个线程在做什么事情
0:002> kb
ChildEBP RetAddr  Args to Child
0438d2c4 770fd993 00000698 00000000 00000000 ntdll!ZwWaitForSingleObject+0x15
0438d328 770fd877 00000000 00000000 014d0000 ntdll!RtlpWaitOnCriticalSection+0x13e
0438d350 770fdaf8 014d0138 7334c875 00078000 ntdll!RtlEnterCriticalSection+0x150
0438d42c 770f2fe3 000001f8 00000200 00000000 ntdll!RtlpAllocateHeap+0x159
0438d4b0 770f7bfb 014d0000 00800000 000001f8 ntdll!RtlAllocateHeap+0x23a
0438d4fc 770f70f1 00000028 7334c9d5 07240048 ntdll!RtlpAllocateUserBlock+0xae
0438d58c 770ee0e2 07240048 07240048 00000000 ntdll!RtlpLowFragHeapAllocFromContext+0x802
0438d600 770f8129 014d0000 00000000 00000020 ntdll!RtlAllocateHeap+0x206
0438d610 770f3f21 04560000 07240048 00000000 ntdll!RtlpAllocateDebugInfo+0x28
0438d64c 770f4262 07240048 00000000 00000000 ntdll!RtlInitializeCriticalSectionEx+0x93
0438d660 771031e2 07240048 07240048 04560000 ntdll!RtlInitializeCriticalSection+0x12
0438d674 771031b0 00000000 00000800 04560000 ntdll!RtlpInitializeLowFragHeap+0x28
0438d684 77102f5a 7334cae5 045600cc 04560000 ntdll!RtlpCreateLowFragHeap+0x28
0438d6bc 77103002 04560000 04560194 0438d7a8 ntdll!RtlpActivateLowFragmentationHeap+0xc9
0438d6cc 77102fce 04560000 7334cbf1 00000000 ntdll!RtlpPerformHeapMaintenance+0x2a
0438d7a8 770f2fe3 00000008 00000010 04560194 ntdll!RtlpAllocateHeap+0x172
0438d82c 6fef1e62 04560000 00000008 00000008 ntdll!RtlAllocateHeap+0x23a
0438d844 6fef20f9 0438d858 04560984 00000007 nlaapi!NlapAllocNlaDataSet+0x18
0438d85c 6fef2096 00000007 00000003 045608f0 nlaapi!QueryCtxtDeserializeTuplesToTrieMap+0x20
0438d888 6fef23a7 045608f0 000003c8 04560958 nlaapi!QueryCtxtDeserializeEntityToTrieMap+0x38
0438d924 6fef58e0 7972514e 00000001 00000000 nlaapi!NLA_QUERY_HANDLE_completion_internal+0x21f
0438d944 6fef5cd7 00000000 00000000 0c7507d0 nlaapi!NlaRegisterQuery+0x7d
0438d99c 6fef5bac 044907d0 4e3f415a 014587b0 nlaapi!GetNlaV2Handle+0x7e
0438d9d0 769d59b1 01435244 0438db88 044907d0 nlaapi!WSM_NSPLookupServiceBegin_v2+0xc9
0438d9ec 769d598d 01435208 0438db88 00000000 ws2_32!NSPROVIDER::NSPLookupServiceBegin+0x1b
0438da08 769d591c 01458960 0438db88 00000000 ws2_32!NSPROVIDERSTATE::LookupServiceBegin+0x1d
0438da6c 769d57cc 014587b0 0438db88 00000ff0 ws2_32!NSQUERY::LookupServiceBegin+0x18d
0438dabc 0fd7fca2 0438db88 00000ff0 0438dbd0 ws2_32!WSALookupServiceBeginW+0x7f
WARNING: Stack unwind information not available. Following frames may be wrong.
0438dd18 0fd0c6a1 0fa9df49 03ac9c20 03b5da80 libcef!cef_time_delta+0x3ddc22
0438e2f0 0fa9ec71 0438e698 03a91e00 0438e310 libcef!cef_time_delta+0x36a621
0438e37c 0fa8d58f 0438e698 03ac9c00 03b5da80 libcef!cef_time_delta+0xfcbf1
0438eb88 0fa9915f 0438ebc8 fffffffe ffffffff libcef!cef_time_delta+0xeb50f
0438ebe8 0fb3605d 03b5da80 fffffffe 03ac9d20 libcef!cef_time_delta+0xf70df
0438ec04 0fb3744d 03b5da80 fffffffe fffffffe libcef!cef_time_delta+0x193fdd
0438ecd8 0fb37ad2 00000003 fffffffe 00000000 libcef!cef_time_delta+0x1953cd
0438edc0 0fb37f5d 03ac9400 11c9bee1 03ac9400 libcef!cef_time_delta+0x195a52
0438edfc 0fa9ab19 03ac9400 03ac9c38 03ac9c00 libcef!cef_time_delta+0x195edd
0438f20c 0fa9b466 03ac9400 00000000 03ac9c38 libcef!cef_time_delta+0xf8a99
0438f220 0fb3c815 00000000 03ac9400 0fb3aee5 libcef!cef_time_delta+0xf93e6
0438f2e8 0fb3d2e3 00000000 03b53384 03ac9c38 libcef!cef_time_delta+0x19a795
0438f690 0fb3ad7b 0438f600 03b53384 03b2ddc0 libcef!cef_time_delta+0x19b263
0438f8ac 0f985613 0438fb64 03b53384 00000001 libcef!cef_time_delta+0x198cfb
0438fbec 0f98016a ffffffff ffffffff 03b53368 libcef!cef_string_multimap_free+0x18b63
0438fc28 0fa208a4 03b53340 03ac0dd0 03a87b00 libcef!cef_string_multimap_free+0x136ba
0438fd70 0fa223ba 0438fdd0 03a878c0 03ac0d00 libcef!cef_time_delta+0x7e824
0438fe0c 0fa4edfc 00000000 03a878c0 03ac0dd0 libcef!cef_time_delta+0x8033a
0438fe3c 0fa4ec2e 00000000 03ac0dd0 03ac0dd0 libcef!cef_time_delta+0xacd7c
0438fe5c 0fa2177f 03ac0dd0 0438ff34 03ac0dd0 libcef!cef_time_delta+0xacbae
0438ff24 0fa3a323 03a8d7d0 0fa1fc56 03ac0dd0 libcef!cef_time_delta+0x7f6ff
0438ff50 0fa39b9b 0438ff74 0fa39c6a 03ac0dd0 libcef!cef_time_delta+0x982a3
0438ff58 0fa39c6a 03ac0dd0 03a80f40 03a8d7d0 libcef!cef_time_delta+0x97b1b
0438ff74 0fa22ad8 00000000 00000000 03a80f40 libcef!cef_time_delta+0x97bea
0438ff88 75b9336a 000001a8 0438ffd4 770f9882 libcef!cef_time_delta+0x80a58
0438ff94 770f9882 03a80f40 7334e38d 00000000 kernel32!BaseThreadInitThunk+0xe
0438ffd4 770f9855 0fa22a80 03a80f40 00000000 ntdll!__RtlUserThreadStart+0x70
0438ffec 00000000 0fa22a80 03a80f40 00000000 ntdll!_RtlUserThreadStart+0x1b
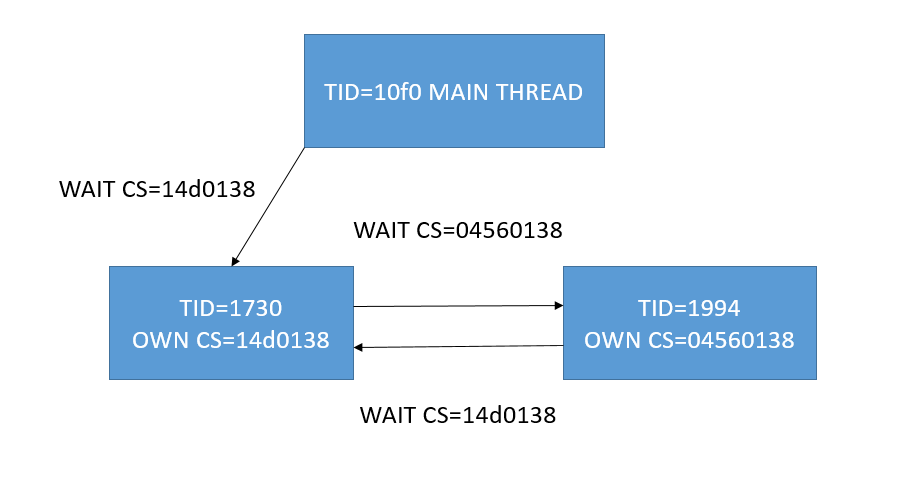
这个线程正在为04560000这个heap创建LowFragHeap,但是在获取014d0138的cs的时候被卡住了。这里就发现问题所在了!014d0138不正是我们主线程在等待的cs么,这个线程的10f0和1994都在等待1730的cs=014d0138,而1730却在等待1994的cs=04560138。
反汇编RtlpQueryExtendedHeapInformation就能知道这里造成死锁的真正原因。实际上Heap32Next函数枚举所有Heap信息的时候,先统一锁住进程里面所有的Heap,然后做枚举工作,最后再统一释放锁。所以它在正在锁住所有HeapLock过程中的时候,例如锁住了一半,正在尝试锁住另一半,另外一个线程正好拥有他没锁住的HeapLock,但是不巧的时候他在给这个Heap创建LowFragHeap,而创建LowFragHeap需要初始化HeapLock,其中HeapLock的DebugInfo又是用默认Heap去分配内存的,默认堆的锁正好在第一个线程被锁住的那一半里,这就是事情的真相!
那么微软为什么要提供一个会造成死锁的API,而且不去修复呢?按照Raymond的说法,这个系列的函数目的只是诊断,性能很低,不应该用于普通程序中。http://blogs.msdn.com/b/oldnewthing/archive/2012/03/23/10286665.aspx