0CCh Blog

主线程退出前请先退出子线程

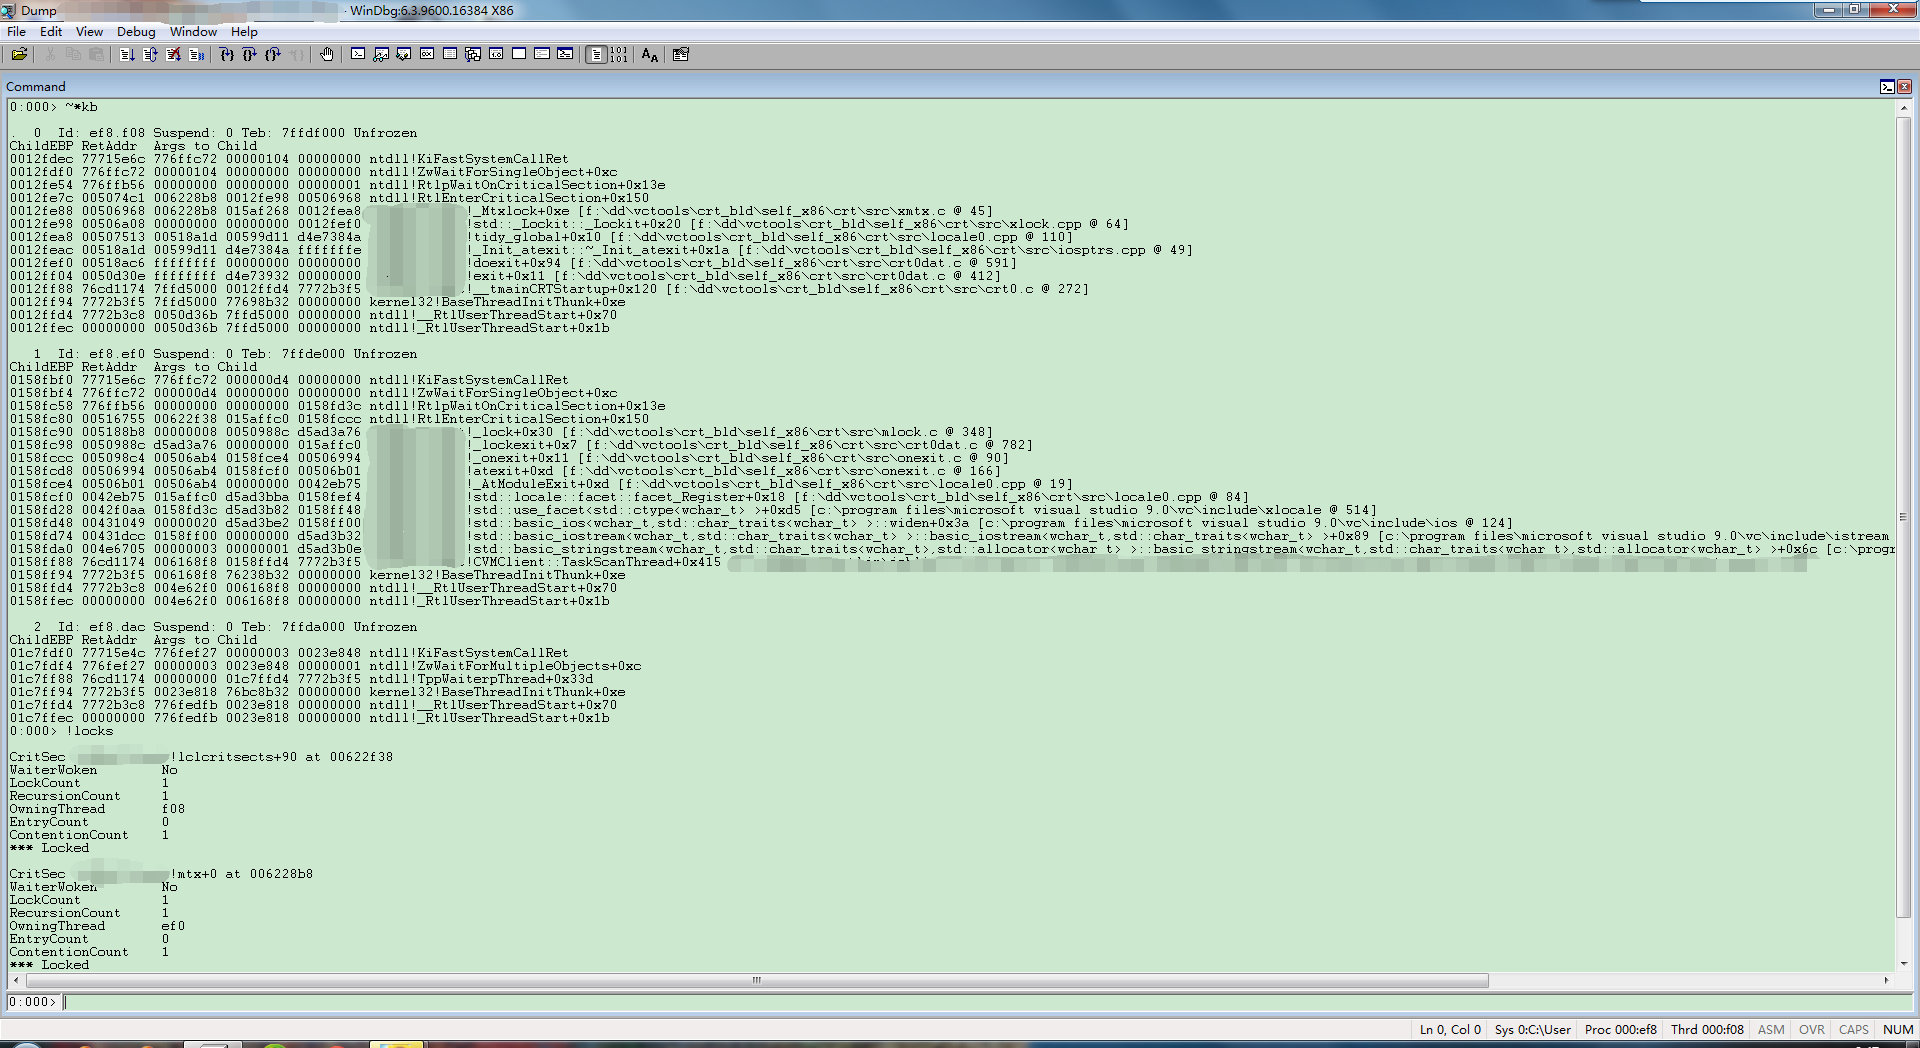
我们知道理论上如果一个进程的主线程退出,整个进程就会销毁,子线程自然也是要退出的。但是这并不意味着,程序退出的时候我们就能不问不管自己创建的子线程,因为不管他还真有可能出问题。下面是一个典型的主线程退出过程中,而子线程未退出,造成死锁整个进程的分析图,死锁在c runtime里,死锁原因看图便知,也不用太多解释了。

20141106094954

ClipMonitor 简单的剪切板监控工具

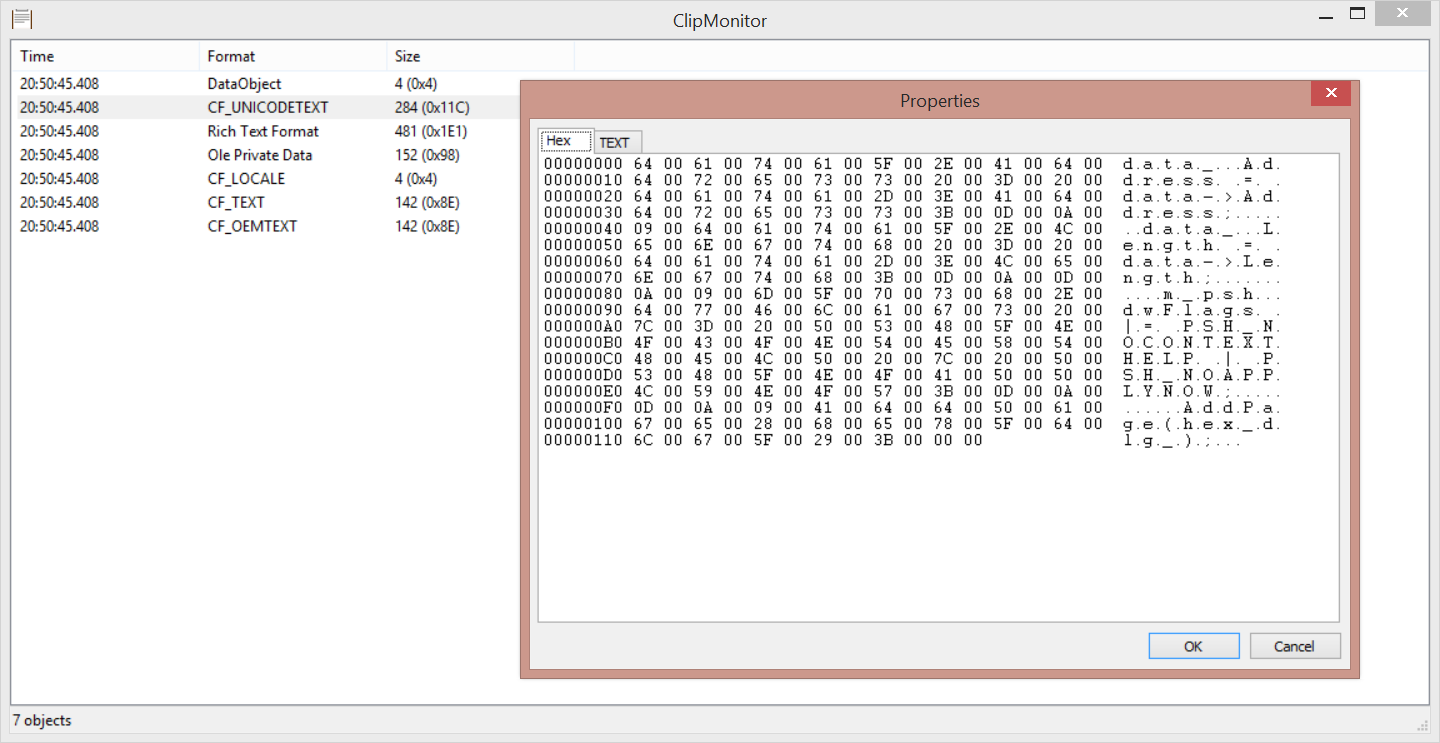
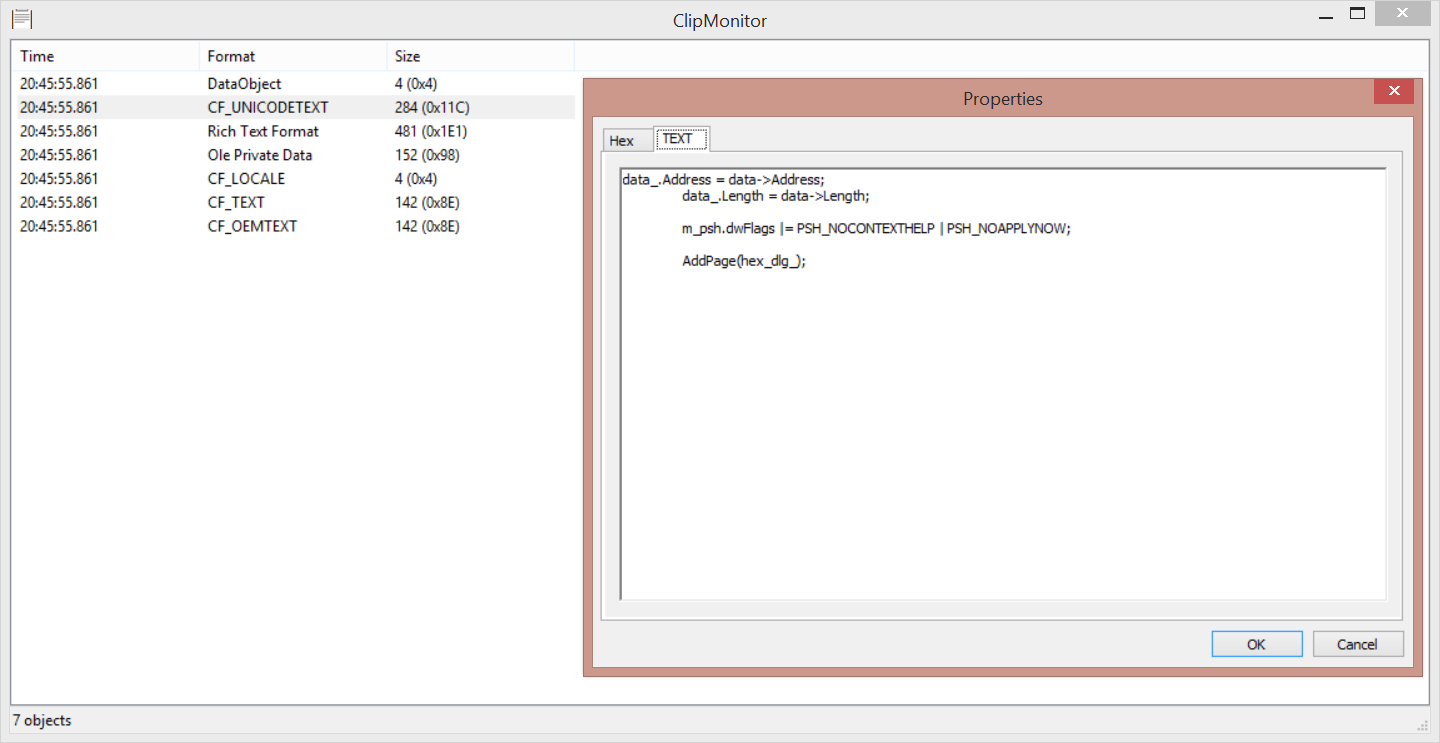
周末花了点时间写了个剪切板监控工具,他会记录剪切板里面的数据,并且支持用HEX和TEXT对数据进行分析。
涉及到的技术很简单,网上已经有一堆了,没什么可说的,我这里主要是加入了HEX的模块,方便对未知的剪切板数据进行分析而已。

20141102204618

20141102204638

20141102204651

下载:ClipMonitor

利用Windbg脚本监控DLL加载状态

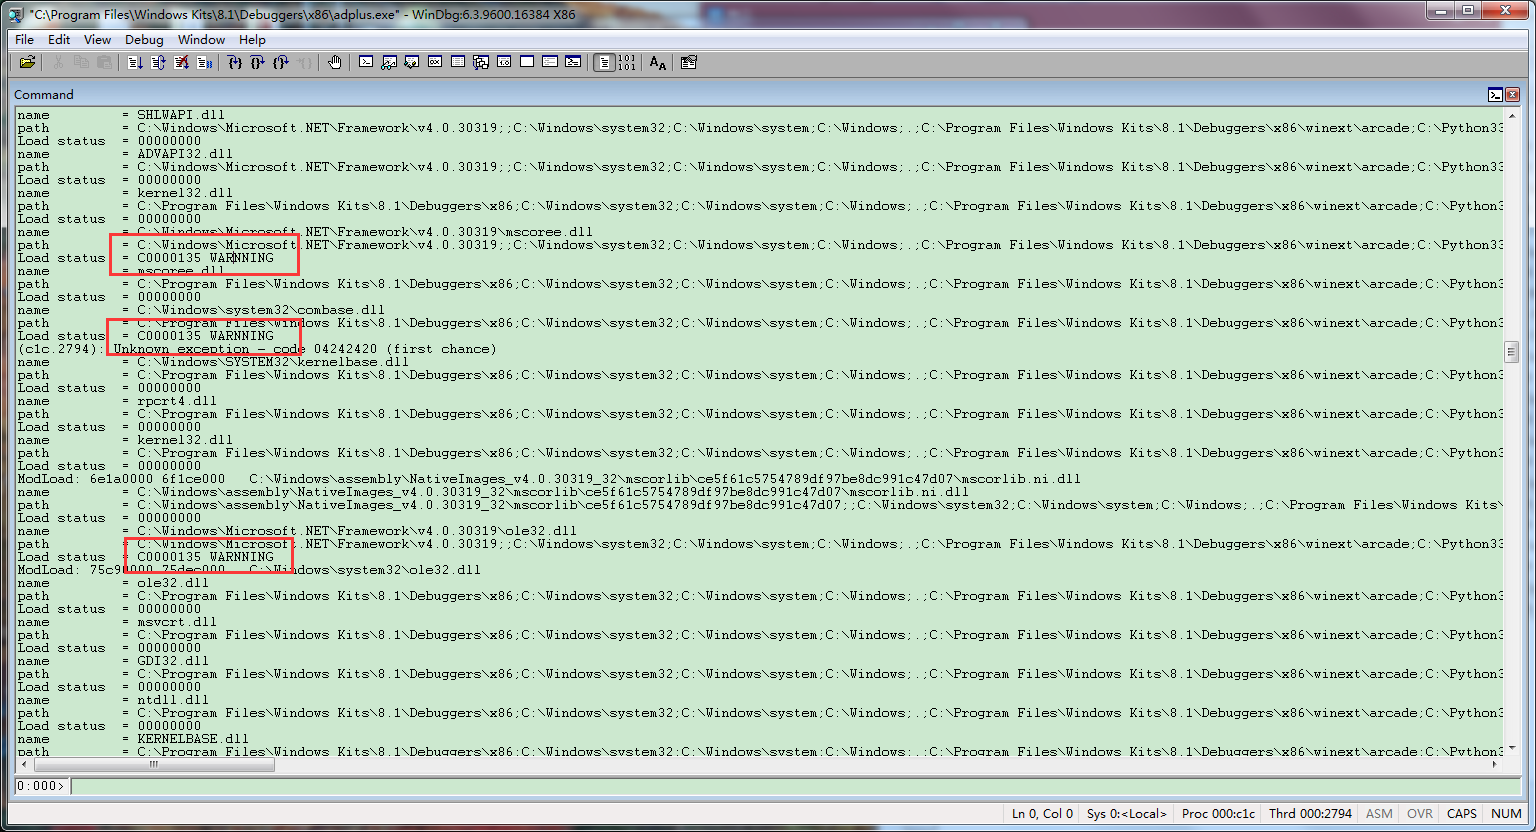
开发过大型程序的人都遇到过这样的问题,一个版本Release后,发现有的功能怎么也不对。但是每个模块在开发人员单独的环境下又是正常运行。那么遇到这样的问题,其中一个能想到的就是DLL模块没有加载正确。一般情况下,这种时候我们可以使用depends这样的工具查看模块的依赖情况,以判断出哪个模块是出问题的那个。但是如果如果真的遇上大型的程序,DLL模块很多,而且动态静态加载不一,这样光靠depends这样的工具是不能满足需求的。所以我这里写了个Windbg脚本来监控DLL加载状态,因为是动态调试,所以很轻松的就能找到加载问题,无论DLL是静态加载还是动态加载。

以下脚本是Windows 7 32Bit,对于64bit,稍微修改下就行。不过如果是Windows 8,DLL的加载细节已经发生变化,所以这个脚本就不适用了。希望能抛砖引玉一下,期待更多系统的脚本分享出来。

bp ntdll!LdrpFindOrMapDll "
.push /r /q
r @$t0 = poi(@esp+4)
r @$t1 = poi(@esp+8)

g @$ra

.printf \"name = %msu\\n\", @$t0
.printf \"path = %msu\\n\", @$t1
.printf \"Load status = %08X\", @eax

.if((@eax&0xffffffff) != 0) {.printf /D \" WARNNING\\n\"} .else {.printf \"\\n\"}

.pop /r /q
g
"

最后看看脚本的效果吧,如果加载失败了,那么返回的状态值就不是0。
20141027164220
20141027164424

用Windows Event监控前台窗口变化

网络上有这样一种小工具,号称可以提高计算机响应速度。简单看了下其中的一款工具,实现原理很简单,就是监控前台窗口的变化,设置进程线程的优先级。设置进程线程的优先级无非就是SetPriorityClass和SetThreadPriority这两个函数,主要问题就是要获得前台窗口的情况。
Windows提供了一种叫做Windows Event Hook的机制,来让我们获得多种不同的事件,其中一种就是前台窗口变化事件。所以要完成这个功能很简单,只需要注册一个针对EVENT_SYSTEM_FOREGROUND的HOOK就行了。注册和反注册Hook的函数分别是SetWinEventHook和UnhookWinEvent。
比如注册EVENT_SYSTEM_FOREGROUND事件的Hook,我们只需要这样:

HWINEVENTHOOK hWinEventHook = SetWinEventHook(
EVENT_SYSTEM_FOREGROUND, EVENT_SYSTEM_FOREGROUND,
NULL, WinEventProc, 0, 0,
WINEVENT_OUTOFCONTEXT | WINEVENT_SKIPOWNPROCESS);

前两个参数设置我们感兴趣的事件范围,由于我们最后一个参数设置的WINEVENT_OUTOFCONTEXT,表示Hook函数并不在产生Event的进程内部,所以hmodWinEventProc设置为NULL。WinEventProc则是我们的Hook函数idProcess和idThread为0,表示我们关心所有桌面上的进程线程,最后的flags还有一个WINEVENT_SKIPOWNPROCESS表示我们对自己的进程不感兴趣。
要反注册Hook只需要

UnhookWinEvent(hWinEventHook);

WinEventProc的很简单

void CALLBACK WinEventProc(
HWINEVENTHOOK hWinEventHook,
DWORD event,
HWND hwnd,
LONG idObject,
LONG idChild,
DWORD dwEventThread,
DWORD dwmsEventTime
)
{
if (hwnd &&
idObject == OBJID_WINDOW &&
idChild == CHILDID_SELF &&
event == EVENT_SYSTEM_FOREGROUND) {
...
}
}

其中只需要知道hwnd就是当前的前台窗口就行了。然后通过hwnd和函数GetWindowThreadProcessId,获得进程线程id,自然就能获得其句柄,最后调用调整进程线程优先级的函数即可。

更新Windbg扩展0cchext

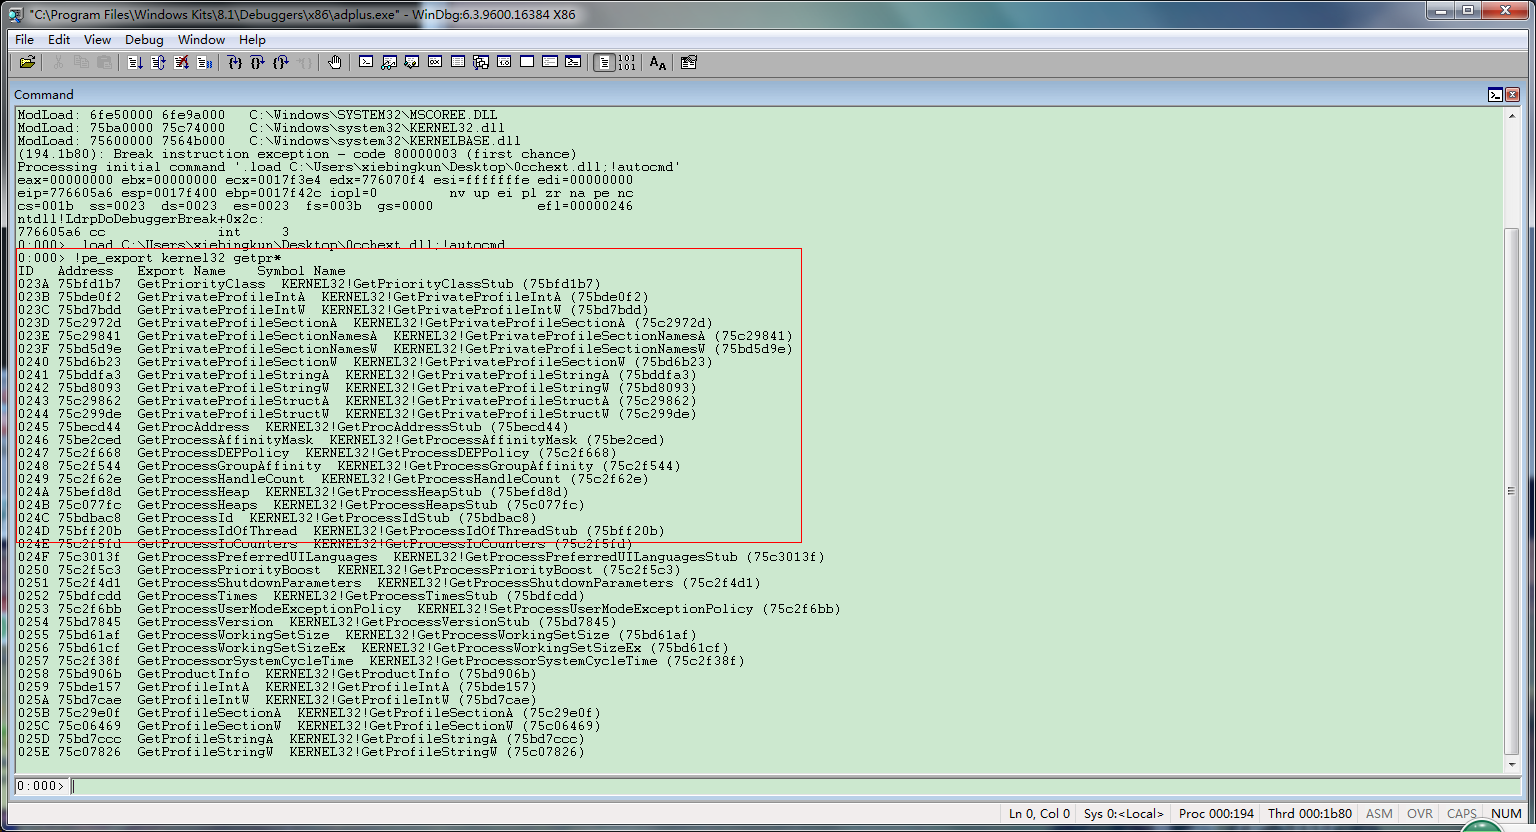
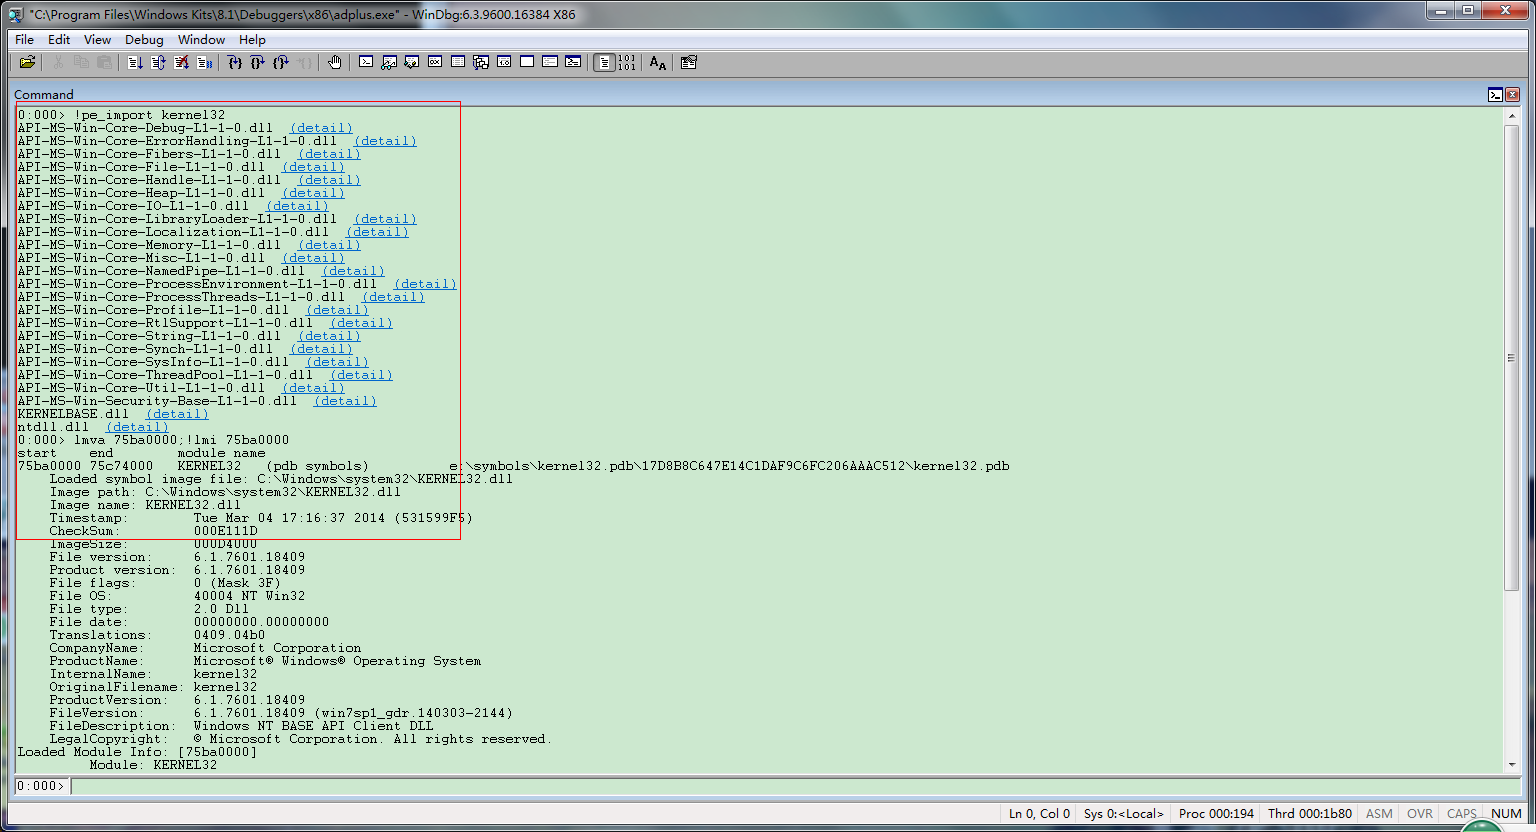
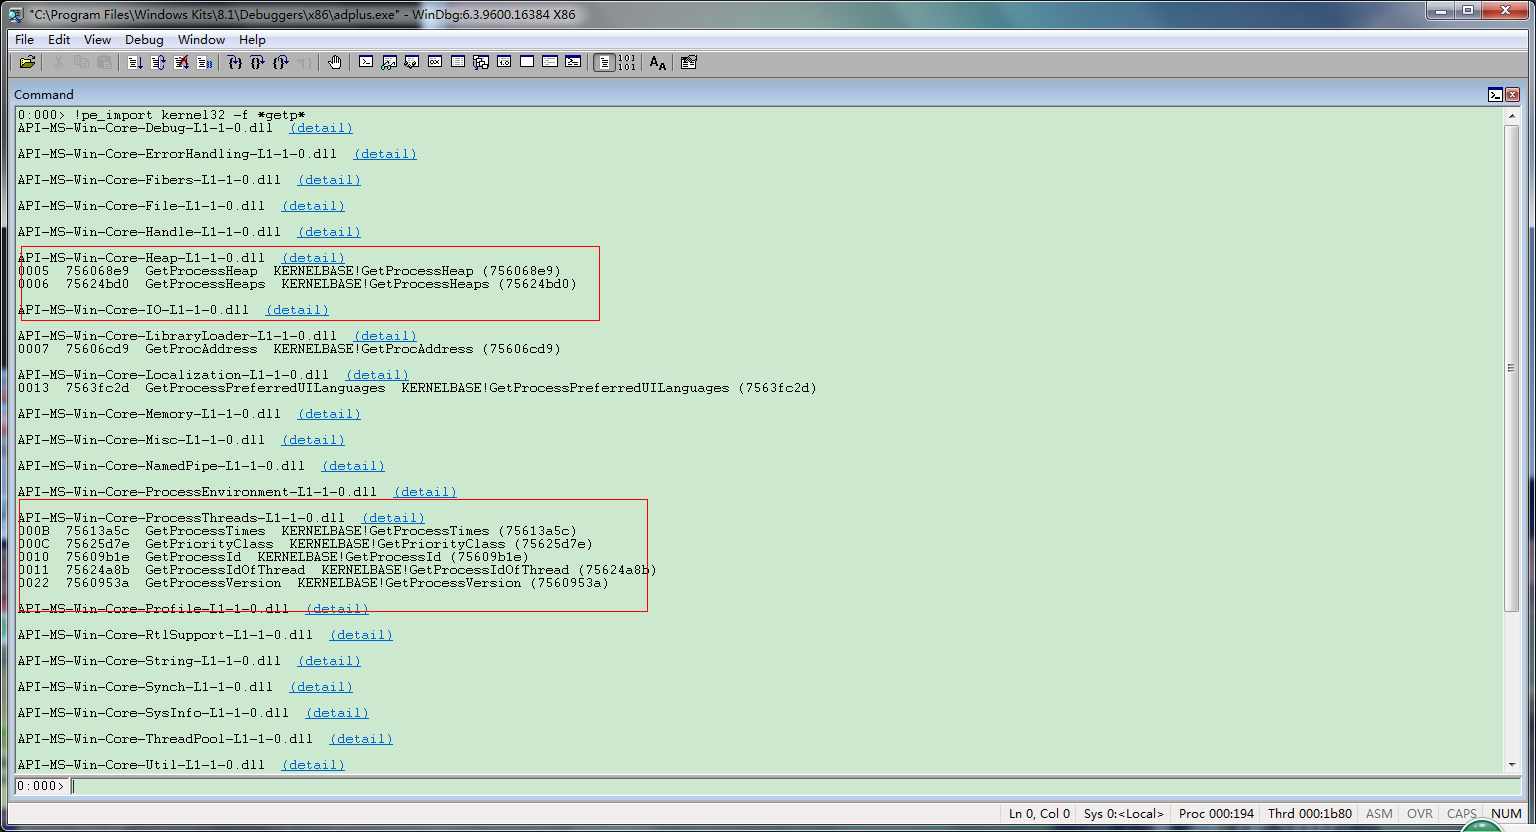
更新了pe_export和pe_import两个命令,功能如图

20140919095914

20140919100003

20140919100101

Commands for 0cchext.dll:
!autocmd - Execute the debugger commands.(The config file is
autocmd.ini)
!dpx - Display the contents of memory in the given range.
!dtx - Displays information about structures. (The config file is
struct.ini)
!favcmd - Display the favorite debugger commands.(The config file is
favcmd.ini)
!grep - Search plain-text data sets for lines matching a regular
expression.
!help - Displays information on available extension commands
!hwnd - Show window information by handle.
!init_script_env - Initialize script environment.
!pe_export - Dump PE export functions
!pe_import - Dump PE import modules and functions
!setvprot - Set the protection on a region of committed pages in the
virtual address space of the debuggee process.
!url - Open a URL in a default browser.
!version - Displays the version information for 0cchext.dll
!help will give more information for a particular command

下载:0cchext

Dump stl的vector,list,map的三个windbg脚本

用Windbg查看stl的容器实在是已经让人悲伤的事情,为了方便,所以写了这么3个脚本
vector:

r? $t0 = ${$arg1}

.if (${/d:$VectorType}) {
r? $t0 = @@C++(*((${$VectorType} *)@$t0))
}

.if (${/d:$arg2}) {
.if ($sicmp("${$arg2}", "-c") == 0) {
r $t2 = 0
aS ${/v:command} "${$arg3}"
}
}
.else {
r $t2 = 1
aS ${/v:command} " "
}


r? $t1 = @@C++(@$t0._Mylast)
r? $t0 = @@C++(@$t0._Myfirst)

.printf "size = %d\n", @@C++((@$t1 - @$t0))

.while (@$t0 != @$t1) {
.if ($t2 == 1) {
?? @@c++(@$t0->_Bx)
}
.else {
r? $t9 = @$t0->_Bx
command
}

r? $t0=@$t0+1
}

ad command

list:

r? $t0 = ${$arg1}

.if (${/d:$ListType}) {
r? $t0 = @@C++(*((${$ListType} *)@$t0))
}

.if (${/d:$arg2}) {
.if ($sicmp("${$arg2}", "-c") == 0) {
r $t2 = 0
aS ${/v:command} "${$arg3}"
}
}
.else {
r $t2 = 1
aS ${/v:command} " "
}

.printf "size = %d\n", @@C++(@$t0._Mysize)

r? $t1 = @@C++(@$t0._Myhead)
r? $t0 = @@C++(@$t0._Myhead)
r? $t0 = @@C++(@$t0->_Next)

.while (@$t0 != @$t1) {
.if ($t2 == 1) {
?? @@c++(@$t0->_Myval._Bx)
}
.else {
r? $t9 = @$t0->_Myval._Bx
command
}

r? $t0 = @@C++(@$t0->_Next)
}

ad command

map:

.if ($sicmp("${$arg1}", "-n") == 0) { 

.if (@@C++(@$t0->_Left) != @@C++(@$t1)) {
.push /r /q
r? $t0 = @$t0->_Left
$$>a< ${$arg0} -n
.pop /r /q
}

.if (@@C++(@$t0->_Isnil) == 0) {
.if (@$t2 == 1) {
.printf /D "%p\n", @$t0, @$t0
.printf "key = "
?? @$t0->_Myval.first
.printf "value = "
?? @$t0->_Myval.second
}
.else {
r? $t9 = @$t0->_Myval
command
}
}

.if (@@C++(@$t0->_Right) != @@C++(@$t1)) {
.push /r /q
r? $t0 = @$t0->_Right
$$>a< ${$arg0} -n
.pop /r /q
}

}
.else {

r? $t0 = ${$arg1}

.if (${/d:$MapType}) {
r? $t0 = @@C++(*((${$MapType} *)@$t0))
}

.if (${/d:$arg2}) {
.if ($sicmp("${$arg2}", "-c") == 0) {
r $t2 = 0
aS ${/v:command} "${$arg3}"
}
}
.else {
r $t2 = 1
aS ${/v:command} " "
}


.printf "size = %d\n", @@C++(@$t0._Mysize)

r? $t0 = @$t0._Myhead->_Parent
r? $t1 = @$t0->_Parent

$$>a< ${$arg0} -n

ad command
}

使用ATLTRACE打造轻量级Debug Log

众所周知,Debug Log是非常好的调试手段。所以我经常也尝试各种各样的第三方Log库。Log库分很多类型,例如可以给服务器使用的功能完备Log,也有轻量级的Log库,只是为Debug所设计。作为客户端开发,我还是比较喜欢后者这种Log库。不过使用第三方库有一个这样的麻烦事,走到哪你都得下一个,然后添加到自己的代码里。对于Log这样的功能,几乎所有程序都是需要的,使用的极其频繁。所以我就想找到一种方法,它可以使用SDK现有功能,来完成一个轻量级Log的功能。对我来说,不需要这个Log有多么高效,完备,唯一需要的就是方便,拿来就可以用。

结合这些目的,我第一个想到的就是ATL的ATLTRACE。但是,ATLTRACE输出的日志都是显示在Debug Output窗口。如果想将信息输出到文件或者控制台上,这就够呛了。那么,接下来就要想办法改变ATLTRACE的输出设备了。由于ATL是有代码的,所以很容易的可以看到代码运行的脉络。看完这份代码的第一个收获就是知道了ATLTRACE运行效率不会很高,不过这个对我来说并不重要。另外一个就是,找到了改变输出设备的方法。

在没有定义_ATL_NO_DEBUG_CRT的情况下,ATLTRACE最终的输出是通过_CrtDbgReport实现的,而如果定义了这个宏,那么输出是直接调用OutputDebugString。但一般程序都不会使用_ATL_NO_DEBUG_CRT这个宏,所以大部分情况下ATLTRACE都是调用的_CrtDbgReport。那么办法就来了_CrtDbgReport输出的数据,是可以通过_CrtSetReportMode和_CrtSetReportFile来改变输出设备的。例如我们想输出到控制台,我们只需要这样:
_CrtSetReportMode(_CRT_WARN, _CRTDBG_MODE_FILE);
_CrtSetReportFile(_CRT_WARN, _CRTDBG_FILE_STDOUT);

如果要输出到文件也只需要这样:
HANDLE log_file;
log_file = CreateFile(“c:\log.txt”, GENERIC_WRITE,
FILE_SHARE_WRITE, NULL, CREATE_ALWAYS,
FILE_ATTRIBUTE_NORMAL, NULL);
_CrtSetReportFile(_CRT_WARN, log_file);
CloseHandle(log_file);
或者
freopen( “c:\log2.txt”, “w”, stdout);
_CrtSetReportMode(_CRT_ERROR, _CRTDBG_MODE_FILE);
_CrtSetReportFile(_CRT_ERROR, _CRTDBG_FILE_STDOUT);

好了,这样就能解决输出设备的问题。既然已经说到这里,继续介绍下ATLTRACE很少人知道的其他优点吧。
1.可以通过ATL/MFT TRACE Tool 随时设定Log的输出Filter,并且可以保持配置(工具用法很简单,具体直接用用就知道了)。
2.通过AtlDebugAPI的接口,可以给自己的代码中添加读取配置文件的函数。这样每次修改配置文件就能改变ATLTRACE的行为。
3.通过AtlDebugAPI的接口,可以直接制定输出内容,不用配置文件也可以。
这三条涉及到的接口有:
AtlTraceOpenProcess
AtlTraceModifyProcess
AtlTraceCloseProcess
AtlTraceLoadSettings

为了更方便使用,我这写了几个宏代码如下:
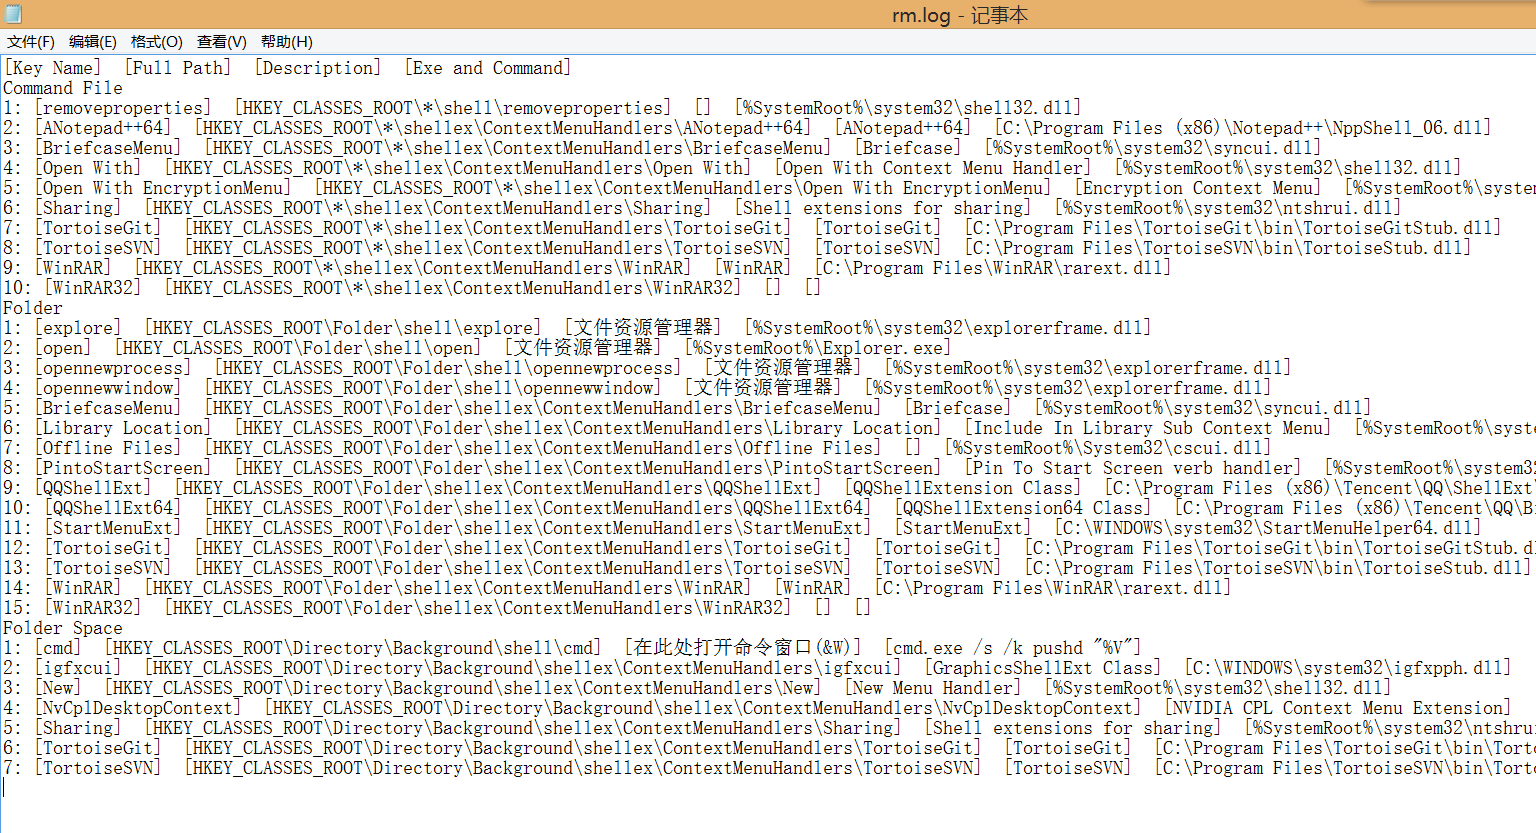
#include <atlbase.h>
#include <atltrace.h>
#include <atldebugapi.h>
#include <atlpath.h>

#define TRACEHELPA(fmt, ...) \
do \
{ \
SYSTEMTIME tm; \
GetLocalTime(&tm;); \
ATLTRACE("%s: [%02d-%02d-%02d %02d:%02d:%02d:%03d] "fmt, __FUNCTION__, \
tm.wYear, tm.wMonth, tm.wDay, tm.wHour, tm.wMinute, tm.wSecond, tm.wMilliseconds, __VA_ARGS__); \
} while (0)

#define TRACEHELPW(fmt, ...) \
do \
{ \
SYSTEMTIME tm; \
GetLocalTime(&tm;); \
ATLTRACE(L"%S: [%02d-%02d-%02d %02d:%02d:%02d:%03d] "fmt, __FUNCTION__, \
tm.wYear, tm.wMonth, tm.wDay, tm.wHour, tm.wMinute, tm.wSecond, tm.wMilliseconds, __VA_ARGS__); \
} while (0)

#define TRACEHELPEXA(category, level, fmt, ...) \
do \
{ \
SYSTEMTIME tm; \
GetLocalTime(&tm;); \
ATLTRACE(category, level, "%s: [%02d-%02d-%02d %02d:%02d:%02d:%03d] "fmt, __FUNCTION__, \
tm.wYear, tm.wMonth, tm.wDay, tm.wHour, tm.wMinute, tm.wSecond, tm.wMilliseconds, __VA_ARGS__); \
} while (0)

#define TRACEHELPEXW(category, level, fmt, ...) \
do \
{ \
SYSTEMTIME tm; \
GetLocalTime(&tm;); \
ATLTRACE(category, level, L"%S: [%02d-%02d-%02d %02d:%02d:%02d:%03d] "fmt, __FUNCTION__, \
tm.wYear, tm.wMonth, tm.wDay, tm.wHour, tm.wMinute, tm.wSecond, tm.wMilliseconds, __VA_ARGS__); \
} while (0)

#define SetAtlTraceOpt(level, enable, category, filename_lineno, report_type, report_file) \
do \
{ \
DWORD_PTR trace_process = AtlTraceOpenProcess(GetCurrentProcessId()); \
AtlTraceModifyProcess(trace_process, level, enable, category, filename_lineno); \
AtlTraceCloseProcess(trace_process); \
_CrtSetReportMode(level, report_type); \
if (report_type == _CRTDBG_MODE_FILE) { \
_CrtSetReportFile(level, report_file); \
} \
} while (0)

#define LoadAtlDebugCfgExA(path) \
do \
{ \
DWORD_PTR trace_process = AtlTraceOpenProcess(GetCurrentProcessId()); \
AtlTraceLoadSettingsA(path, trace_process); \
AtlTraceCloseProcess(trace_process); \
} while (0)

#define LoadAtlDebugCfgExW(path) \
do \
{ \
DWORD_PTR trace_process = AtlTraceOpenProcess(GetCurrentProcessId()); \
AtlTraceLoadSettingsU(path, trace_process); \
AtlTraceCloseProcess(trace_process); \
} while (0)

#define LoadAtlDebugCfgA() \
do \
{ \
CHAR debug_cfg_path[MAX_PATH] = {0}; \
GetModuleFileNameA(NULL, debug_cfg_path, MAX_PATH); \
CPathA debug_cfg_path_obj(debug_cfg_path); \
debug_cfg_path_obj.RemoveExtension(); \
debug_cfg_path_obj.AddExtension(".trc"); \
LoadAtlDebugCfgExA(debug_cfg_path_obj.m_strPath.GetString()); \
} while (0)

#define LoadAtlDebugCfgW() \
do \
{ \
WCHAR debug_cfg_path[MAX_PATH] = {0}; \
GetModuleFileNameW(NULL, debug_cfg_path, MAX_PATH); \
CPathW debug_cfg_path_obj(debug_cfg_path); \
debug_cfg_path_obj.RemoveExtension(); \
debug_cfg_path_obj.AddExtension(L".trc"); \
LoadAtlDebugCfgExW(debug_cfg_path_obj.m_strPath.GetString()); \
} while (0)

int _tmain(int argc, _TCHAR* argv[])
{

SetAtlTraceOpt(_CRT_WARN, true, true, true, _CRTDBG_MODE_FILE, _CRTDBG_FILE_STDOUT);
LoadAtlDebugCfgW();
CTraceCategory MY_CATEGORY(_T("MyCategoryName"));
TRACEHELPEXA(MY_CATEGORY, 0, "test test test\n");
TRACEHELPEXW(MY_CATEGORY, 0, L"test test test\n");
return 0;
}

更新:Windbg扩展0cchext.dll

Commands for 0cchext.dll:
!autocmd - Execute the debugger commands.(The config file is
autocmd.ini)
!dpx - Display the contents of memory in the given range.
!dtx - Displays information about structures. (The config file is
struct.ini)
!favcmd - Display the favorite debugger commands.(The config file is
favcmd.ini)
!grep - Search plain-text data sets for lines matching a regular
expression.
!help - Displays information on available extension commands
!hwnd - Show window information by handle.
!init_script_env - Initialize script environment.
!setvprot - Set the protection on a region of committed pages in the
virtual address space of the debuggee process.
!url - Open a URL in a default browser.
!version - Displays the version information for 0cchext.dll
!help will give more information for a particular command

下载:0cchext

系统进程创建管理员进程的方法

代码如下:


namespace ProcessHelper {

typedef BOOL (__stdcall *CREATEENVIRONMENTBLOCK)(LPVOID *lpEnvironment,
HANDLE hToken,
BOOL bInherit);

BOOL CreateProcessAsExplorer(LPCTSTR AppName, LPTSTR CommandLine, PPROCESS_INFORMATION pi)
{
ULONG ExplorerID = 0;
HANDLE ExplorerHandle;
HANDLE Snapshot;
ULONG CreationFlags = 0;
CREATEENVIRONMENTBLOCK CreateEnvironmentBlock;
HANDLE ExplorerToken;
HANDLE NewToken = 0;
LPVOID Environment = NULL;
ULONG ReturnLength = 0;
TOKEN_LINKED_TOKEN LinkedToken = {0};
STARTUPINFO si = {0};
PROCESSENTRY32 pe;
BOOL Ret;
HMODULE UserenvModule;
LUID Luid = {0};


Snapshot = CreateToolhelp32Snapshot(TH32CS_SNAPPROCESS, 0);
if (Snapshot == INVALID_HANDLE_VALUE) {
return FALSE;
}

pe.dwSize = sizeof(pe);
if (Process32FirstW(Snapshot, &pe;)) {

for(;;) {

if (_tcsicmp(pe.szExeFile, L"explorer.exe") == 0) {
ProcessIdToSessionId(pe.th32ProcessID, &Luid.LowPart;);
ExplorerID = pe.th32ProcessID;
break;
}
if (!Process32Next(Snapshot, &pe;)) {
break;
}
}

}

CloseHandle(Snapshot);
if (ExplorerID == 0) {
return FALSE;
}

ExplorerHandle = OpenProcess(PROCESS_QUERY_INFORMATION, FALSE, ExplorerID);
if (ExplorerHandle == NULL) {
return FALSE;
}

if (!OpenProcessToken(ExplorerHandle, TOKEN_ALL_ACCESS_P, &ExplorerToken;)) {
CloseHandle(ExplorerHandle);
return FALSE;
}

CloseHandle(ExplorerHandle);

if (GetTokenInformation(ExplorerToken,
TokenLinkedToken,
&LinkedToken;,
sizeof(TOKEN_LINKED_TOKEN),
&ReturnLength;)) {

NewToken = LinkedToken.LinkedToken;
}
else {

LookupPrivilegeValueW(0, L"SeDebugPrivilege", &Luid;);
DuplicateTokenEx(ExplorerToken, MAXIMUM_ALLOWED, NULL, SecurityIdentification, TokenPrimary, &NewToken;);
}

CloseHandle(ExplorerToken);

UserenvModule = LoadLibrary(TEXT("Userenv.dll"));
if (UserenvModule == NULL) {
return FALSE;
}

CreateEnvironmentBlock = (CREATEENVIRONMENTBLOCK)GetProcAddress(UserenvModule, "CreateEnvironmentBlock");
if (CreateEnvironmentBlock == NULL) {
FreeLibrary(UserenvModule);
return FALSE;
}


if (CreateEnvironmentBlock(&Environment;, NewToken, TRUE)) {
CreationFlags = CREATE_UNICODE_ENVIRONMENT;
}

si.cb = sizeof(si);
Ret = CreateProcessAsUser(
NewToken,
AppName,
CommandLine,
NULL,
NULL,
FALSE,
CreationFlags,
Environment,
NULL,
&si;,
pi);

CloseHandle(NewToken);

if (Environment != NULL) {
DestroyEnvironmentBlock(Environment);
}

if (!Ret) {

return FALSE;
}

return TRUE;
}
}